This paper was written for a class in my program called “Introduction to GIS”.
[1] See http://www.projects.iq.harvard.edu/albaniagrowthlab/overview for more details.
I. Introduction and Context
In 2013, the Albanian government engaged Harvard’s Center for International Development (“CID”) to launch a research project that “aims at identifying Albania’s binding constraints and proposing policy solutions that can relax them1 .” Researchers and experts were to work across a wide range of policy issues including, but not limited to, agriculture, industrial parks, tourism, economic integration with Kosovo, labor markets and the Albanian diaspora.
This project seeks to add to the research output concerning the lattermost topic – the Albanian diaspora – by focusing on the spatial distribution of the Albanian diaspora, regardless of whether they are recent migrants or immigrants of multiple generations in the United States. Specifically, I ask the question, “Where is the Albanian diaspora most populated in the United States and what are the characteristics of the Albanian diaspora in these places, relative to the non-Albanians (Americans and non-Albanian immigrants and diaspora)?”
Answering this question is important as it provides the Albanian government with a meaningful starting point to engage with their diaspora abroad. The population of Albania is approximately three million people. However, there are about three and a half million individuals of Albanian descent living outside the country with the primary destination being the neighboring countries of Italy and Greece. According to the World Bank’s Migration Database, Italy and Greece play host to approximately 1 to 1.2 million Albanians. Other major migrant destinations of Albania include Macedonia at 0.5 million Albanians and the United States at 0.1 million Albanians.
After the collapse of communism in 1991, Albania suffered an economic crisis which led to the exodus of Albanians from Albania. Between 1989 and 2001, approximately 800,000 people migrated out of Albania, the largest such emigration movement in Europe in the post-World War II period. A second wave of migration occurred in 1997, following the Albanian Rebellion of 1997 which was an uprising caused by Ponzi scheme failures which cost the people of Albania $1.2 billion, nearly 50% of Albania’s GDP. After these waves of migration, the Albanian diaspora became larger than the Albanian population.
Given the size of the Albanian diaspora and given that the waves of migration were fairly recent – within the past 25 years – it would stand to reason that there are likely still many ties between the Albanian emigrants and the Albanians in Albania. The emigrants may still have family in Albania or they may still own land and property in Albania. Against the backdrop of these diaspora attributes for Albania, the government of Albania is seeking to craft a diaspora strategy to optimally leverage on its diaspora abroad. Perhaps the most intuitive strategy is to incentivize the return migration of the Albanian diaspora back to Albania. After all, given that in standard economic growth models such as Solow (1956), Lucas (1988) and Romer (1986), the role of labor and human capital is paramount to growth. The logic thus follows that a way to generate growth would be to boost the stock of labor, as one of the proximate factors of growth, and of human capital in Albania.
Discussions with the Albanian Deputy Prime Minister have indicated that they plan to begin their engagement with the diaspora in the United States, primarily because of data availability and the existence of Albanian American business councils and cultural organizations in the United States. Yet, if the intent is to leverage on higher human capital of the Albanian diaspora in the United States, where in the United States should it begin and does the data support the initial prediction? In other words, what type of Albanian diaspora should we expect to see in different locations across the United States? To answer the question, I begin by framing the policy question through a theoretical model of migration first introduced by Borjas (1987).
The Borjas model is based on the Roy (1951) model of occupational choice. Borjas (1987) modifies the Roy model to detail a model that generates predictions about the nature of migrant selection. In essence, the Borjas model predicts the types of migrants that flow to two different nations based on the relative income inequality between those nations. If nation X has a higher relative income inequality than nation Y, then we should expect to see disproportionately more higher-skilled migrants moving from nation Y to nation X to capitalize on those proportionately larger returns to high skills, and we should expect to see disproportionately more lower-skilled migrants moving from nation X to nation Y to capitalize on the proportionately larger returns to low skills. Thus, the more equal a given country relative to a destination country, the more likely it will see high-skilled migrants flow out towards the destination country.
According to the World Bank’s World Development Indicators, Albania’s Gini Coefficient (a measure of income inequality) has an average of 30.4 from 1990 to 2014 while the United States’ Gini Coefficient has an average of 40.1 over the same time period. The standard deviations of both indicators are low at 1.1 and 1.3 respectively. Therefore, Albania is relatively more equal than the United States and consequently, we should expect to see more higher-skilled migrants moving from Albania to the United States to capitalize on the higher returns to high skills in the United States. Furthermore, we should also expect these Albanians to migrate to more economically prosperous locations in the United States. This provides us with a solid starting spatial hypothesis with which to begin the spatial analysis.
II. Data and Methodology
The data is taken from the 2012 American Cultural Survey which is a 1 in 100 weighted sample of households and individuals in the United States. Attributional data that are particularly relevant to this project that is provided by the Survey includes income, wages, education level, type of job, type of industry, occupational prestige scores, and ancestry, among others. Geographic data provided include state, metropolitan area and city. Full definitions of the attributional data are provided in the Appendix.
In terms of geographic data, I chose the geographic unit as the state as opposed to the metropolitan area and city. The reason is one of convenience; certainly, the results would have been more precise had I used more granular geographic units but there were some strong reasons against using metropolitan area and city. First of all, all 3,113,030 observations in the data set have their ‘state’ listed but this is not true of city and metropolitan area. For instance, about 62% of all Albanians (as defined by ancestry, see Appendix) did not have their cities listed. This is also true of metropolitan areas. Next, from the standpoint of ArcGIS compatibility, a vector layer of polygons representing states in the United States was more convenient to obtain as opposed to vectors of polygons that represented cities and metropolitan areas which may or may not have been coded identically to the Survey data. Based on these reasons, I chose ‘state’ as my geographic unit of analysis and I argue that nearly all Albanians are likely to be located close to the major cities of those states and thus, ‘state’ can serve as a proxy of ‘city’ fairly reasonably.
To obtain data by state, I collapsed the 3,113,030 observations by state in Stata to obtain 50 states and 1 federal territory – District of Columbia. In collapsing the data, I chose to collapse by the mean for income, wages, education levels and occupational prestige scores while for total population of Albanians and non-Albanians, I chose to collapse by the sum. For jobs and industries, I collapsed by sum for each type of job for each state. Thus, I had 51 units of geographic observations with the various attributional data. To create the maps in ArcGIS, I used a one-to-one join with a vector of polygons of states in the United States, taken from the Government 1016 database.
The first map details the population of Albanians in the United States relative to non-Albanians. While, from a cartographic standpoint, the legends are different in the two data-frames, it is important to know how many Albanian diaspora there are in the United States while in terms of the population of the non-Albanians in each state, that fact is much less important and hence, breaks by decile are adequate. The next map compares the income of Albanians in the United States relative to non-Albanians. The classifications are based on natural breaks. This is also true of the next two maps which compare Albanians versus non-Albanians across states in the United States by Occupational Prestige and mean education respectively. For symbology, I chose colors which better represented larger or smaller quantities (hence across one color gradient) for the population and for income. For mean education and occupational prestige which are more categorical in nature, I chose colors which are easily identifiable from one another. The maps are displayed in Section III. In Maps 2, 3, and 4, I have removed Hawaii and Alaska simply because there is no Albanian diaspora there and thus, focusing on the continental United States is sufficient.
To deepen the analysis, I consider measures of spatial autocorrelation, asking if income and education for Albanians in given locations are correlated with the income levels and education levels for Albanians in nearby states. Smaller units of geographic analysis would have been preferred but given the limitations of the data, I employ spatial autocorrelation by state, mindful that the results are likely to be biased especially in larger states whose main cities or urban areas are not close to their neighbor’s respective main cities, such as in California. I use both the Global Moran’s I – given that my data, being averages, can be thought of as continuous – and the Local Moran’s I. The former enables me to check if there is significant autocorrelation overall while the latter enables me to see if there are pockets where there is significant autocorrelation between states. Identifying spatial autocorrelation is also important from a policy standpoint. If resources are limited, which they almost always are, then prioritization is key. If wealthy Albanians, for example, are located close to one another and if we can pinpoint exactly where these clusters are, then we can identify a starting point for the rollout of the Albanian government’s intended diaspora policy.
With these methodological tools in mind, I present the results and discuss them in the next section.
III. Results and Discussion
Recall that based on the Borjas (1987) model, we should expect to see more high-skilled migrants from Albania into the United States. Therefore, we should expect to see an Albanian diaspora profile that is more highly-educated, has a higher occupational prestige score and has a higher income. All maps produced are displayed in Appendix A.
Map 1 shows the distribution of Albanians in the United States. Predictably, the population of Albanians is large in New York and Massachusetts, given that they are two of the richest states in the United States2 (as can be seen in Map 2 for Non-Albanians). Furthermore, New York is arguably the economic center of the United States and if the hypothesis of observing high-skilled migrants from Albania is to hold, then it makes sense that the Albanian diaspora would be large in New York. What is perhaps less intuitive is that there is a large Albanian diaspora (more than 20,000 individuals of Albanian ancestry) in Michigan. Given that Michigan ranks at 38th in GDP per capita among all states in the United States, it is not so straightforward to explain why there is a large diaspora of Albanians in Michigan. One possible explanation is that Albanians flock to Michigan for higher education purposes. Michigan is well-known for several outstanding higher education institutions and might be a possible attraction for Albanians (and other internationals). However, the existing data does not allow the exploration of that hypothesis.
Map 2 compares the mean total income of individuals of Albanian descent versus individuals of non-Albanian descent across states in the United States. The Albanian diaspora with the highest mean incomes are in Louisiana, Washington, D.C. and North Carolina. Furthermore, in New York and Massachusetts, the average total incomes are $27,877 and $44,359 respectively. For the non-Albanians, the states with the highest mean incomes are Washington, D.C., Connecticut and Maryland. The mean total incomes for New York and Massachusetts are $38,373 and $42,463 respectively. That mean incomes for Albanians and non-Albanians in Washington, D.C., are high makes sense; these are usually filled with government posts or diplomatic posts or workers at international organizations which tend to pay well (given expatriate pay). What is surprising for the Albanian diaspora is that the highest income Albanians are located in Louisiana and North Carolina which are ranked 21st and 27th in GDP per capita in 2014 among all states in the United States.
There are at least two plausible explanations for this. The first is that the Borjas (1987) model works on an even more granular level than just country to country. If Louisiana and North Carolina are among the most unequal states in the United States – 34th and 47th respectively in the most recent 2010 statistics – then migrants may self-select themselves to these states. The higher-skilled migrants would then earn a higher income than non-Albanians especially if they were relatively more skilled or more educated than the state average. This argument has some merit. If it were true, then we should see migrants self select to the most unequal states namely New York, Connecticut and Massachusetts which we observed from Map 1. The second plausible explanation is that despite Louisiana and North Carolina not being the conventional business or economic powers of the United States, they may have a large Albanian diaspora because of the historical success of Albanian businesses and individuals of prior generations. This may have led to a historical path dependence situation where Albanians moved to Louisiana and North Carolina to help out in those businesses and thus have higher incomes (since those businesses were successful).
However, the hypothesis of higher incomes of the Albanian diaspora falls short in New York. Notice that the mean total income for Albanians was higher in Massachusetts vis-à-vis nonAlbanians, but the opposite was true for New York. Therefore, despite the Borjas (1987) model predicting that higher incomes for Albanian migrants should have been observed in New York, the average income of non-Albanians was higher and substantially so at approximately $10,000. A potential explanation for this is simply that the model was true; higher-skilled Albanians did migrate to New York. However, the model says nothing about whether migrants would get the jobs they seek or jobs commensurate with their skill level in their new locations. Therefore, one aspect of migration that is beyond the scope of this project is to evaluate the notion that a highlyskilled Albanian engineer may end up being a taxi driver in New York and hence, despite being more highly-skilled than the average New Yorker, that individual’s income would be lower than the average non-Albanian individual in New York.
In terms of occupational prestige, an inspection of the Map 3 indicates that the most prestigious occupations for Albanians are held in Florida, Georgia, Maryland, New Mexico and Arizona. For non-Albanians, these jobs are concentrated in the northeast – Massachusetts, New Hampshire and Vermont. What is also worth noting is the comparison of the map’s legends’ natural breaks for both groups. The two lowest occupational prestige score intervals for Albanians are lower than those of non-Albanians. However, at the upper end, the two highest occupational prestige score intervals for Albanians are higher than those of non-Albanians. This implies that the distribution of occupational prestige is much wider for Albanians than for non-Albanians; Albanians hold relatively high and low prestige jobs while non-Albanians are more equally distributed in the middle. The top score for occupational prestige for Albanians is 35 while it is only 30 for non-Albanians. Thus, the higher overall scores seem to indicate support for the hypothesis borne out of the Borjas (1987) model.
An explanation for the low prestige occupations may be seen again by a comparison between Albanians and non-Albanians in New York and Massachusetts. The occupational prestige for Albanians in both New York and Massachusetts was lower than for non-Albanians in both those cities. We can see from the map that the most prestigious jobs in the United States for nonAlbanians was in Massachusetts (at a score of 27 to 30) while New York scored 24. This is in contrast to the occupational prestige scores of Albanians in Massachusetts and New York at 23- 25 and 0-18 respectively. This therefore supports the notion that while high-skilled Albanians may have migrated to these areas, they may not have attained prestigious jobs. Thus, the anecdote of an engineer becoming a taxi driver in New York may be applicable here and thus, we observe the overall lower end occupational prestige scores for Albanians as well.
Map 4 compares education levels between Albanians and non-Albanians in the United States. There is a similar trend to that of occupational prestige. The distribution of education for nonAlbanians is more well-balanced and has a lower standard deviation; this is not true of Albanians who record both relatively much lower and relatively much higher education levels. The highest interval for non-Albanians is an average education of between high school and some associate degree while for Albanians, the average education at the highest interval is between some associate degree and a master’s degree. In Massachusetts, Albanians have, on average, slightly higher education levels while in New York, the average Albanian has a lower education level than the average non-Albanian. This negates the engineer as cab driver explanation for lower occupational prestige and lower incomes, but it does provide an alternative reason for those observations; the average Albanian in New York is simply less educated than the average nonAlbanian and hence, they have lower occupational prestige and lower incomes. However, this concept still holds true for Massachusetts; while the average education of Albanians is relatively higher, the occupational prestige is lower. Unfortunately, the project data set does not provide granular enough information to adequately analyze that issue.
Next, I analyze the spatial autocorrelation of Incomes and Education levels among Albanians. For Incomes, the Global Moran’s Index indicator reads at 0.016. This implies almost no spatial correlation of Income levels for Albanians between states. The p-value of the indicator, which represents the statistical significance of the Global Moran’s I result is also large at 0.7, meaning that the pattern does not appear to be significantly different from random. This is corroborated by the Local Moran’s I map, which shows the significance, or lack thereof, of spatial clusters of incomes of Albanians across states. Only the states with the teal borders are included in the analysis as these are the states in which the Albanian diaspora is present. Notice that only Louisiana, which is a significant high-low cluster relative to the states surrounding it, is statistically significant based on the Local Moran’s I analysis. No high-high significant cluster exists. Therefore, prioritization of diaspora policies by income cannot be thought of at a regional level, but must henceforth focus on particular states.
For Education, we observe the same result. The Global Moran I’s indicator is -0.046, with a pvalue of 0.86. The spatial autocorrelation pattern is therefore not significantly different from random and thus, there is little to no spatial autocorrelation of Education levels of Albanians. The Local Moran’s I also shows a similar result to that of Income. There is a significant HighLow cluster at Louisiana while Texas and Mississippi are Low-High clusters. There is still no High-High cluster which might be a good place to begin a diaspora policy; the rest of the states are not clustered in a statistically significant way. Therefore, from an Education perspective, prioritization of diaspora policies must also be focused on individual states as opposed to regions.
On the whole, the hypothesis sees rather mixed preliminary spatial evidence. More high-skilled Albanians do seem to migrate to the United States and earn higher incomes in states like Louisiana, North Carolina, Washington D.C., Massachusetts and so on but New York seems to be an anomaly. More low-skilled Albanians (by lower education level) seem to move to New York and hence, the average Albanian in New York makes less money and has a less prestigious job than the average non-Albanian. Further, there is effectively no spatial autocorrelation of Income and Education for Albanians, indicating that the ‘types’ of Albanian diaspora are dispersed around the United States.
IV. Caveats, Conclusions and The Way Forward
On the whole, this analysis has provided a starting point for the Albanian government to pursue their diaspora strategy. Specifically, it should look to leverage on the Albanian diaspora not necessarily by region but rather by state, perhaps beginning in Massachusetts, Washington D.C. and North Carolina as well as potentially Louisiana. Furthermore, what may have been a natural starting place – New York, as the economic and financial center of the United States – may not be an adequate starting platform for the policy.
This analysis is not without its caveats and potential errors. From a technical perspective, there is always the possibility of measurement error in data collection. Furthermore, the 1% sample taken from the American Cultural Survey may not actually be a representative sample as well. Next, from a spatial perspective, some of the data may be flawed, particularly in areas near borders, as people may live in one state and commute to another for work. This is particularly true for the Washington, D.C. and Maryland area as well as Connecticut and New York. Thus, richer Albanians who do work in New York may be living in Connecticut and this would severely bias the New York results. Another issue is that of prior-current job correlation. This omitted variable is important as it may affect several variables in this discussion (occupational prestige, income etc.) but is beyond the scope of this dataset. It would help to address some of the concerns regarding the engineer-taxi driver confounding scenario. Next, the unit of geographic analysis here is the ‘state’ which may be large. More granular units of geographic analysis such as the city may be more helpful here and reduce some of the bias that comes with taking the averages of attributes. For instance, people in the suburbs may have higher incomes than those who live downtown but it is impossible to separate these two groups at the state level.
The spatial analysis may also be subject to Modifiable Areal Unit Problem (MAUP) which is defined as “a problem arising from the imposition of artificial units of spatial reporting on continuous geographical phenomenon resulting in the generation of artificial spatial patterns.” The MAUP is comprised of two components; the first is the scale effect variation that occurs due to the choice of the number of zones used in a given analysis while the second is the zonation effect which is the variation in numerical results arising from the grouping of small areas into larger units. This study is vulnerable to the latter. Given that I am aggregating up to the state level, much of the more granular data at the city or metropolitan area may be lost and hence, spatial patterns may be biased.
From a more analytical perspective, the project dataset is not sufficiently nimble and granular to analyze channels through which the results may be biased. New York, for instance, is an anomaly. Why do low-skilled Albanians move to New York when relative inequality is higher in New York than it is in Albania? Sure, the income they earn may be more than what they would get in Albania, but that explains only recent migrants and not the diaspora. Furthermore, if there is a premium on being a return migrant (suppose people perceive someone who has worked abroad as more skilled), why not return to Albania and enjoy relatively higher purchasing power? There are a myriad of reasons surrounding those questions and is an avenue for future analysis but is beyond the scope of this paper. Furthermore, it would be helpful to include qualitative interviews with the Albanian diaspora to further support (or detract) the hypotheses put forward in this paper.
Moving forward, this paper can serve as a platform for diaspora policy. However, it must be supplemented with further work. The bulk of this paper is descriptive; research focusing on causal chains must follow with more granular data, at a smaller unit of geographic analysis such as the city. Qualitative research would also be very welcome. Micro-level data can be used for spatial analysis moving forward, tackling the issues of omitted variable bias at the granular level. For instance, if we had city data, we could see what sorts of cities attract different types of Albanian diaspora in the United States. We could construct a ‘city use’ index which delineates the roles of the city as an economic power, a center for higher education, a retirement area (Miami in Florida) and so and see how far away different types of Albanians live from these sorts of areas via a spherical buffer around those centers. This sort of data also enables interpolation of spatial data and thus increases the predictive power of the analysis to support policy recommendations.
Appendix A – Maps
Map 1 – Population of Albanians versus non-Albanians in the United States
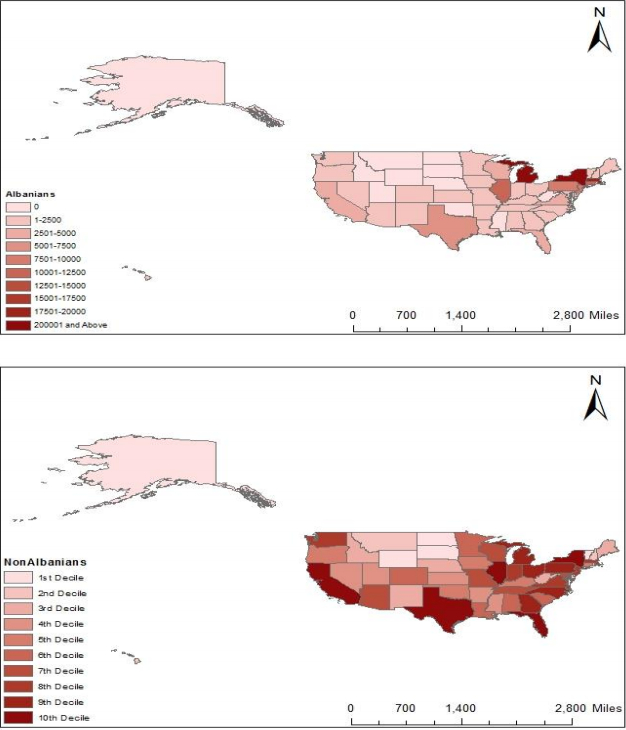
Sources: American Cultural Survey 2012, Government 1016 data
Map 2 – Mean Income of Albanians versus non-Albanians in the United States

Sources: American Cultural Survey 2012, Government 1016 data
Map 3 – Occupational Prestige of Albanians versus non-Albanians in the United States

Sources: American Cultural Survey 2012, Government 1016 data
Map 4 – Mean Educational Differences and Mean Education Levels for Albanians versus non-Albanians in the United States

Sources: American Cultural Survey 2012, Government 1016 data
Appendix B – Spatial Autocorrelation Reports
Moran’s Global I – Output on Spatial Correlation of Albanians by Income

Moran’s Global I – Output on Spatial Correlation of Albanians by Education

Moran’s Local I – Output on Clustering of Albanians in the United States by Income (Map 1) and Education (Map 2)

Sources: American Cultural Survey 2012, Government 1016 data, Author’s Calculations
References
Borjas, G. (1987). “Self-Selection and the Earnings of Immigrants.” American Economic Review, 77(4), pp. 531-553.
Borjas, G. (1991). “Immigration and Self-Selection.” In Immigration, Trade, and the Labor Market, edited by John M. Abowd and Richard B. Freeman, 29-76. Chicago: University of Chicago Press.
Lucas, R. (1988). “On The Mechanics of Economic Development.” Journal of Monetary Economics, 22, pp. 3-42.
Romer, P. (1986). “Increasing Returns and Long-Run Growth.” Journal of Political Economy, 94(5), pp. 1002-1037.
Roy, A.D. (1951). “Some Thoughts on the Distribution of Earnings.” Oxford Economic Papers New Series, 3(2), pp. 135-146.
Solow, R. (1956). “A Contribution to the Theory of Economic Growth.” Quarterly Journal of Economics, 70(1), pp. 65-94.